Technoeconomics on a napkin
Can a factory deliver custom freeze-cast terracotta at the price of flat extruded panels? This page is the steady-state algebra of such a factory: freeze dryers and kilns, the molds and people between them, and the price per square metre that carries a margin. The Manual tab lets you set every number; the Optimize tab asks, for a demand you name, which machines and how many. The two tabs keep separate inputs.
Units: euros per square metre of façade. A square metre is 10.54 pieces of 30 × 30 cm on an 8 mm joint; a building is 580 m². The dashed line is the deck's USD 80/ft² (€797/m²). The grey band is flat extruded terracotta ex-works, €100–330/m²; the top is a real USD 33/ft² quote, the bottom is inferred.
The piece
Mass follows the effective solid depth: a solid 10 cm piece is nine litres, a hollow-backed one about five and a half. At 60 % solids every litre holds 1.5 kg of clay and 0.4 kg of ice. N = 10.54 pieces per m².
Freeze dryers
Batch machines: so many molds per load, so many hours per load, so many chambers. Their yearly capacity is the first of the two throughput limits; their owning cost is shared over whatever the plant actually makes.
Kilns
The second throughput limit. Shuttle kilns fire a chamber-full per cycle; a tunnel kiln fires tonnes a day continuously and burns about half the gas per kilogram. The plant makes the smaller of the two capacities.
Molds and masters
Each piece is cast in a silicone mold that survives a number of casts; each design needs a printed master. A mold can never make more casts than a design repeats in a building, whatever the silicone can take.
Labor, scrap and shipping
Plant, overhead and price
What is left once the machines are paid for: the building around them, the people who are not on the floor, the selling, and the margin. Fixed sums are divided by the square metres the plant sells, so they dominate a small plant and vanish in a large one.
The three napkins, restated for a plant
Everything above is one function: price per square metre of a plant, steady state. The napkins are three ways of setting its inputs, and now they carry the whole plant, not one chamber.
Napkin A: parity is possible
The hollow-backed line: 55 FD1800s, a tunnel kiln, 5.5 cm of clay per piece, 660 molds per 26 h load, 95 % yield. Price at 40 % margin €287/m², inside the band, with SG&A and overhead inside the price. Mass is what makes it work: 79 kg/m² against the panel's 57.
Napkin B: parity is impossible
The same line making the solid 10 cm piece: €408/m² at 40 % margin, above the band top. Twice the clay, a longer cycle, and the kiln becomes the bottleneck at 250 tonnes a day. An extrusion line at €50–80/m² of cost is out of reach for either piece.
Napkin C: the skeptic
48 h drying, 250 molds a load, 45 % running, €60M of plant, money at 15 %, 5 min of labor, 30-cast molds, 80 % yield: €1,617/m². The deck's USD 80/ft² becomes the break-even. Load it and watch which bars grew: the two capital lines and scrap, all of them the same division, machines over pieces.
| €/m² | Pilot | Seed line | Line, solid | Line, hollow | Skeptic | Yours |
|---|---|---|---|---|---|---|
| Materials (clay + binder) | €105 | €67 | €46 | €25 | €46 | €46 |
| Drying energy | €43 | €11 | €11 | €7 | €54 | €11 |
| Freeze-dryer capital | €365 | €56 | €20 | €11 | €143 | €20 |
| Firing energy | €13 | €11 | €5 | €3 | €5 | €5 |
| Kiln capital | €84 | €19 | €6 | €3 | €42 | €6 |
| Molds & masters | €81 | €53 | €40 | €33 | €75 | €40 |
| Touch labor | €251 | €96 | €20 | €20 | €40 | €20 |
| Packaging + freight | €5 | €11 | €16 | €16 | €16 | €16 |
| Scrap | €303 | €40 | €9 | €6 | €144 | €9 |
| Building, racking, mold shop capital | €270 | €47 | €16 | €9 | €169 | €16 |
| Fixed overhead (people, rent) | €4,580 | €334 | €7 | €4 | €42 | €7 |
| SG&A | €1,525 | €186 | €49 | €34 | €194 | €49 |
| Margin | €5,084 | €620 | €163 | €115 | €647 | €163 |
| Price | €12,709 | €1,551 | €408 | €287 | €1,617 | €408 |
| Buildings a year | 0.1 | 3.1 | 756.2 | 1,368.3 | 122.3 | 756.2 |
| Capital in the ground | €0.3M | €1.3M | €105.9M | €105.9M | €125.9M | €105.9M |
What decides it
Two divisions. Machines over pieces: every capital line is a fleet's yearly cost divided by the pieces the plant makes, and the plant makes the smaller of what the dryers and the kilns can do. Fixed sums over square metres: overhead divided by output, which is what makes a pilot cost thousands per square metre and a line hundreds. Everything else is a price times a mass or a minute. So the commodity question is: at what plant size, with what drying time and what piece, do those two divisions fall under the band? The Optimize tab searches that directly.
Over time
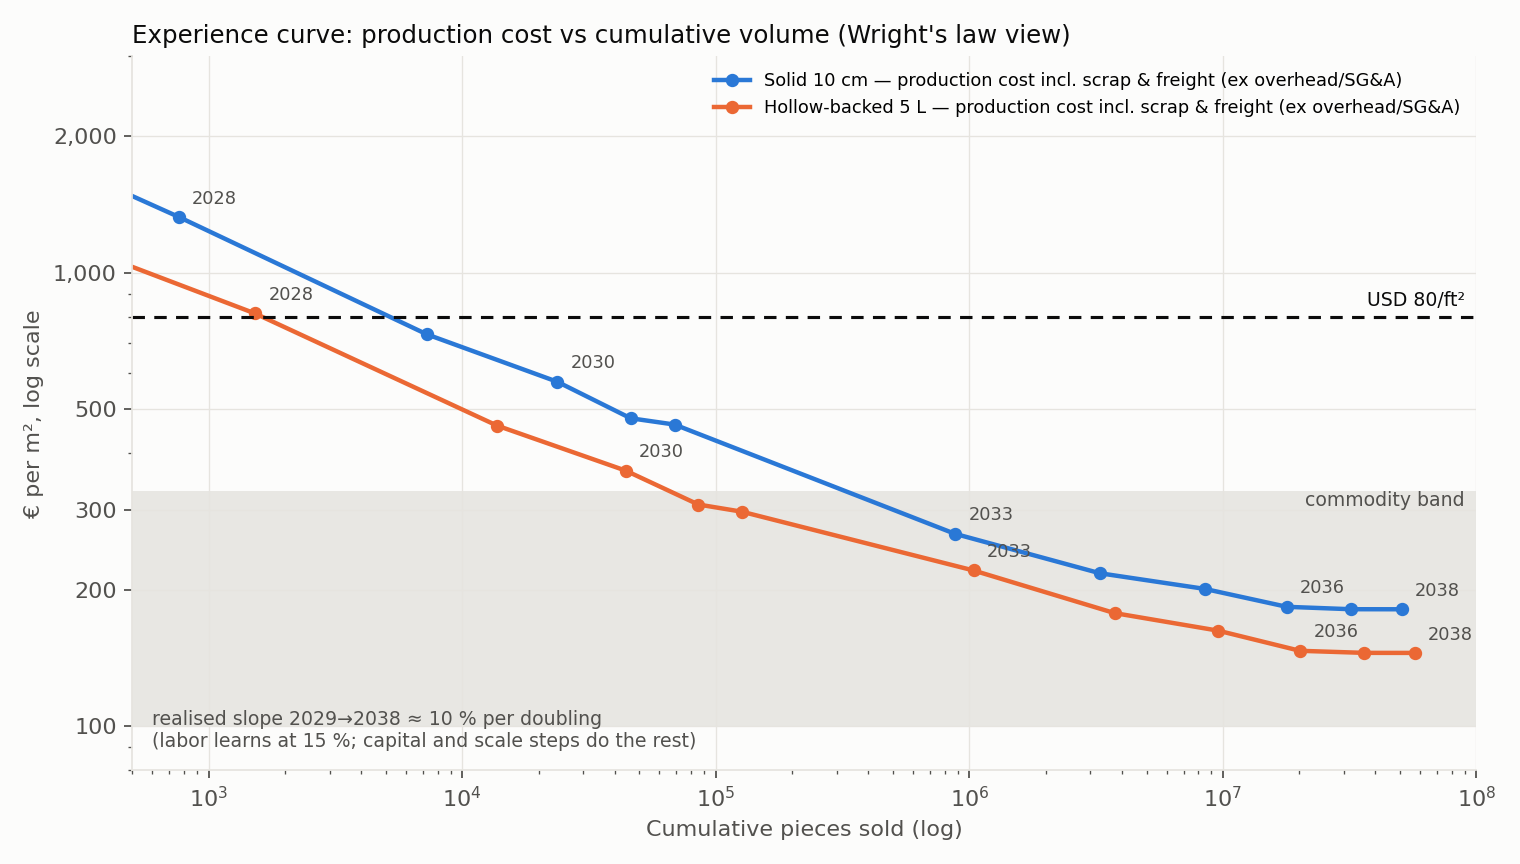
The plant above is a steady state. Getting there is a path: a pilot, a seed line, then production lines, with touch labor learning along the way. Every doubling of cumulative pieces cuts minutes per piece by a fixed share; solar modules did about 20 % per doubling, lithium-ion batteries about 18 %.
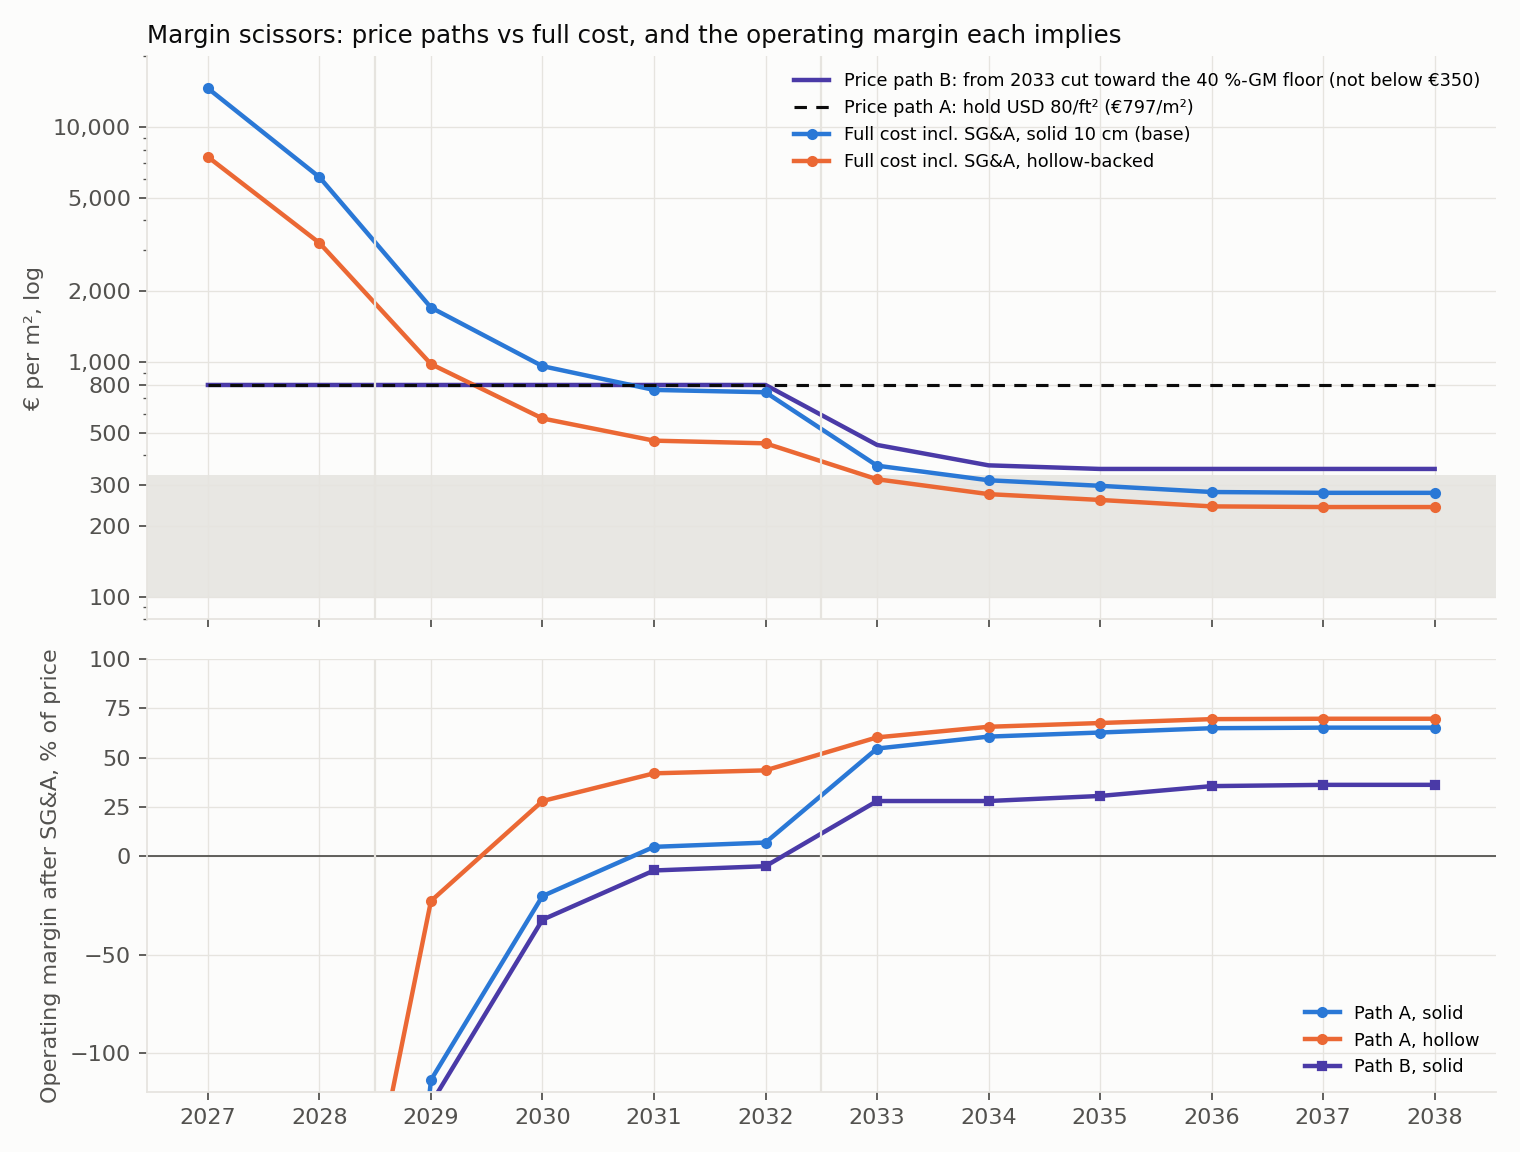
The two figures below are from the time-dependent forecast (vault note “Price Floor and Commodity Parity — Forecast 2026-09-08”), which runs the simulator's cost model and its discrete-event scheduler year by year with phased fleets and learning. They use that note's assumptions, which predate this page, and they are here because the steady-state algebra cannot say when: an experience curve, and the margin scissors between price and cost.
The problem
tload ≥ tfix + tsub,10 × (d ÷ 10)k the drying law
tload ≥ tfix + nload × mice(d) ÷ rice(chamber) the condenser
ncasts ≤ min(nlife, ndesign) mold life and design repetition
dmin ≤ d ≤ dmax the product
a variable marked fixed equals the value you type your constraints
Every line is monotone in the continuous variables, so at the optimum each free one sits on the tightest bound above, and the search is exhaustive over chamber type × kiln type with the fleet sized to the demand. Rounding the fleet up leaves the last machine part-idle; that shows in the utilisation column. A fixed variable can make a design infeasible, and the table says which constraint failed. Everything this tab uses is set on this tab.
Demand
Decision variables
Physics we believe
Target
Cost coefficients
Prices, rates, plant and overhead the objective is built from. Inputs here, not decisions; the Manual tab has its own copy.
Price breakdown of the optimum
Machines
| Allow | Chamber | Price | kW | Usable m³ | Ice kg/h | Molds at 10 cm |
|---|---|---|---|---|---|---|
| Harvest Right HRC100 Pro | €15k | 1.5 | 0.1 | 1.5 | 3 | |
| 78 kg/day pilot dryer | €135k | 5 | 0.6 | 3.3 | 18 | |
| FD100 GPC | €150k | 5.4 | 1.5 | 5.6 | 46 | |
| FD600 GPC | €625k | 55 | 12.6 | 33.3 | 388 | |
| FD1200 GPC | €725k | 82 | 10.9 | 66.7 | 336 | |
| FD1800 GPC | €925k | 110 | 17.5 | 100.0 | 540 |
| Allow | Kiln | Price | MJ/kg | Per firing / per day | Pieces / yr each |
|---|---|---|---|---|---|
| 1,000 L shuttle kiln | €31k | 4.5 | 42 / 18 h | 14,717 | |
| 2 m³ industrial shuttle kiln | €100k | 4 | 73 / 18 h | 25,579 | |
| Tunnel kiln, heavy-clay class | €15M | 2.5 | 250 t / day | 4,866,667 |
Solution: every chamber × kiln, feasible and cheapest first
| Chambers | Kilns | d | nload | tload | Use | Capex | Price | Target |
|---|---|---|---|---|---|---|---|---|
| 65 × FD1800 | 2 × Tunnel kiln | 10 | 540 | 34 | 100 % / 67 % | €130M | €396 | misses by €66 |
| 104 × FD1200 | 2 × Tunnel kiln | 10 | 336 | 34 | 100 % / 67 % | €145M | €412 | misses by €82 |
| 65 × FD1800 | 438 × 1,000 L shuttle kiln | 10 | 540 | 34 | 99 % / 100 % | €114M | €414 | misses by €84 |
| 65 × FD1800 | 252 × 2 m³ industrial shuttle kiln | 10 | 540 | 34 | 99 % / 100 % | €125M | €415 | misses by €85 |
| 137 × FD600 | 2 × Tunnel kiln | 10 | 388 | 52 | 100 % / 66 % | €156M | €416 | misses by €86 |
| 104 × FD1200 | 438 × 1,000 L shuttle kiln | 10 | 336 | 34 | 99 % / 100 % | €129M | €429 | misses by €99 |
| 104 × FD1200 | 252 × 2 m³ industrial shuttle kiln | 10 | 336 | 34 | 99 % / 100 % | €141M | €430 | misses by €100 |
| 137 × FD600 | 438 × 1,000 L shuttle kiln | 10 | 388 | 52 | 100 % / 100 % | €139M | €432 | misses by €102 |
| 137 × FD600 | 252 × 2 m³ industrial shuttle kiln | 10 | 388 | 52 | 100 % / 100 % | €151M | €433 | misses by €103 |
| 884 × FD100 | 2 × Tunnel kiln | 10 | 46 | 40 | 100 % / 66 % | €203M | €438 | misses by €108 |
| 884 × FD100 | 438 × 1,000 L shuttle kiln | 10 | 46 | 40 | 100 % / 100 % | €186M | €454 | misses by €124 |
| 884 × FD100 | 252 × 2 m³ industrial shuttle kiln | 10 | 46 | 40 | 100 % / 100 % | €198M | €455 | misses by €125 |
| 11565 × Harvest Right HRC100 Pro | 2 × Tunnel kiln | 10 | 3 | 34 | 100 % / 66 % | €241M | €506 | misses by €176 |
| 11565 × Harvest Right HRC100 Pro | 438 × 1,000 L shuttle kiln | 10 | 3 | 34 | 100 % / 100 % | €225M | €523 | misses by €193 |
| 11565 × Harvest Right HRC100 Pro | 252 × 2 m³ industrial shuttle kiln | 10 | 3 | 34 | 100 % / 100 % | €236M | €524 | misses by €194 |
| 1928 × 78 kg/day pilot dryer | 2 × Tunnel kiln | 10 | 18 | 34 | 100 % / 66 % | €330M | €540 | misses by €210 |
| 1928 × 78 kg/day pilot dryer | 438 × 1,000 L shuttle kiln | 10 | 18 | 34 | 100 % / 100 % | €314M | €556 | misses by €226 |
| 1928 × 78 kg/day pilot dryer | 252 × 2 m³ industrial shuttle kiln | 10 | 18 | 34 | 100 % / 100 % | €325M | €557 | misses by €227 |